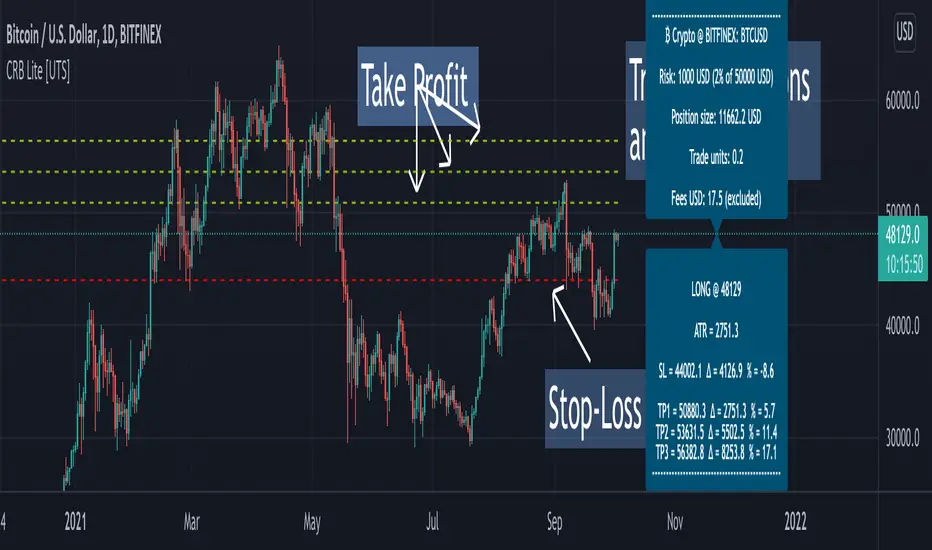
Crypto Risk Buddy - Lite: Position Size, SL & TP System [UTS]
Crypto Risk Buddy - Lite
Position Size, Stop Loss & Take Profit System
The ultimate system to calculate trading risk on crypto assets.
The 'Lite' version is limited to BTC as base currency.
₿ Cyptocurrencies
Position Sizing
De-risk possible drawdown by calculating a proper position size.
Define your risk percent based on your net value
Freely define your account currency
Trade any asset by the customizable Base / Quote currency factor
Calculate trading fees
Show all information on a customizable data screen
Stop Loss
Minimize trade risk by calculating your stop-loss.
Percent, Value and Delta display from current price
ATR based (Average True Range, modifiable)
Custom SL value possible
Adjustable
Two visual representations on chart
Automatically and real-time calculated on screen
Take Profit
Multiple take-profit levels to ensure not giving back to the market.
Up to 3 take profit levels to define
ATR based (Average True Range, modifiable)
Custom TP values possible
Easily customizable
Two visual representations on chart
Automatically and real-time calculated on screen
Currencies
Choose an account currency and calculate your risk for every trading pair.
USD
EUR
GBP
AUD
CAD
CHF
HKD
JPY
NOK
NZD
RUB
SEK
SGD
TRY
ZAR
BTC (crypto)
ETH (crypto)
USDT (crypto)
BUSD (crypto)
USDC (crypto)
In den Scripts nach "take profit" suchen
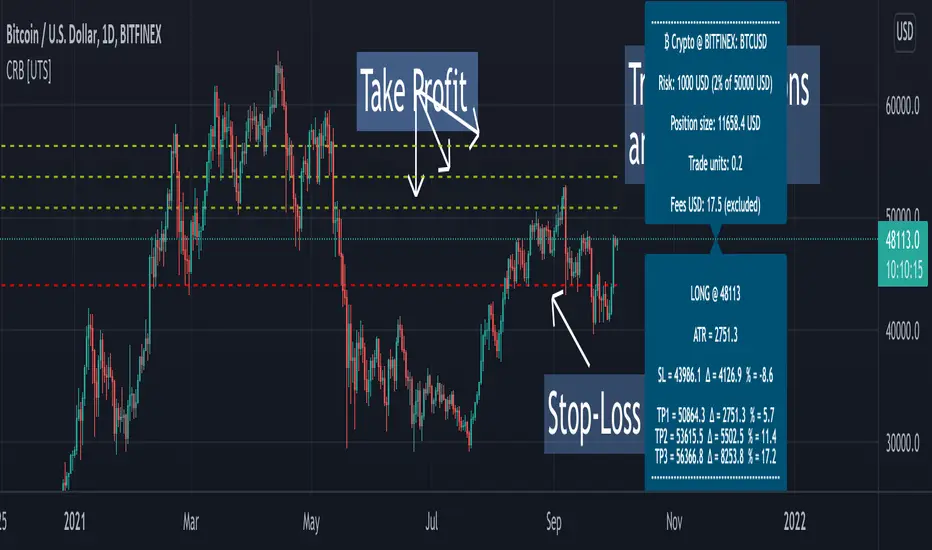
Crypto Risk Buddy: Position Size, SL & TP System [UTS]
Crypto Risk Buddy
Position Size, Stop Loss & Take Profit System
The ultimate system to calculate trading risk on crypto assets.
₿ Cyptocurrencies
Position Sizing
De-risk possible drawdown by calculating a proper position size.
Define your risk percent based on your net value
Freely define your account currency
Trade any asset by the customizable Base / Quote currency factor
Calculate trading fees
Show all information on a customizable data screen
Stop Loss
Minimize trade risk by calculatig your stop-loss.
Percent, Value and Delta display from current price
ATR based (Average True Range, modifiable)
Custom SL value possible
Adjustable
Two visual representations on chart
Automatically and real-time calculated on screen
Take Profit
Multiple take-profit levels to ensure not giving back to the market.
Up to 3 take profit levels to define
ATR based (Average True Range, modifiable)
Custom TP values possible
Easily customizable
Two visual representations on chart
Automatically and real-time calculated on screen
Currencies
Choose an account currency and calculate your risk for every trading pair.
USD
EUR
GBP
AUD
CAD
CHF
HKD
JPY
NOK
NZD
RUB
SEK
SGD
TRY
ZAR
BTC (crypto)
ETH (crypto)
USDT (crypto)
BUSD (crypto)
USDC (crypto)
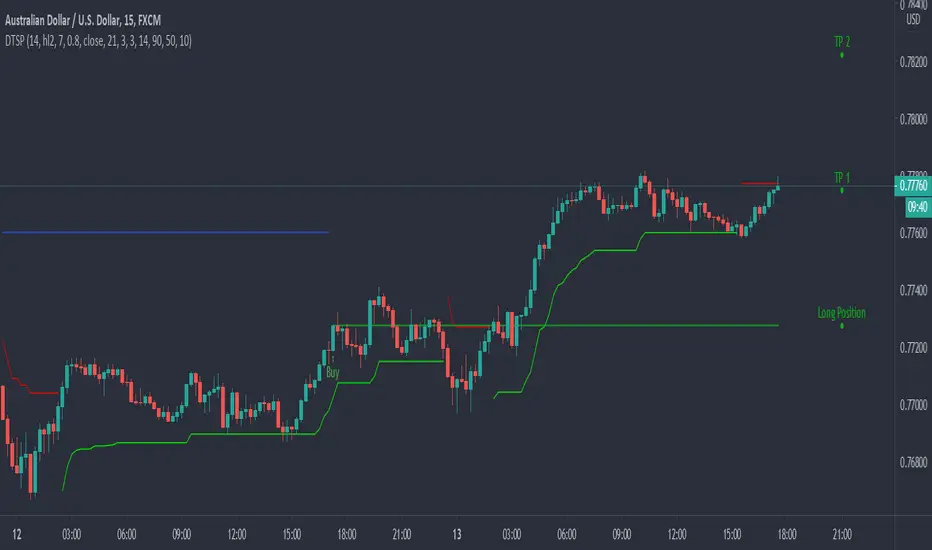
Dynamic Take Profit & Signals (AussieBogan)Dynamic Take Profit & Signals (DTS) help us to dynamically place potential take profit levels. These levels are measured based on standard deviation in conjunction with swing high and low points. Head over to the settings to control your take profit and multiplicative factor setting.
In short, higher values of either setting will return more spread out between tp's. The logic behind using the standard deviation is that a low value of it will return tp closer to where you entered the trade, as such it will have higher chances of the price reaching them.
The Indicator also has alert features for buy and sell so any trader can be aware of every potential signal the indicator produces.
Rockstar Long Take profit flagFlag to indicate a good time to consider taking profit if you are in a long position.
The indicator will show a green diamond in an uptrend where the price is overbought and could pull back.
Conditions for flag:
Price above 20MA
20MA above 50MA
50MA above 200MA
RSI > 70
Close price is far from 20MA (about to pull back and overbought)
All inputs configurable in the settings for the indicator.
Please do not trade based on indicators alone. Use your strategy and be careful!

ATR with Take and StopThis simple indicator will plot the take profit and stop loss values based on the ATR indicator.
It's possible to set how many times the ATR value will be applied to the closing price and
what trade type is used, Long or Short.

ATR Take Profit bandsSimple ATR-scaled levels or bands of suggested price to take profit on directional trades.

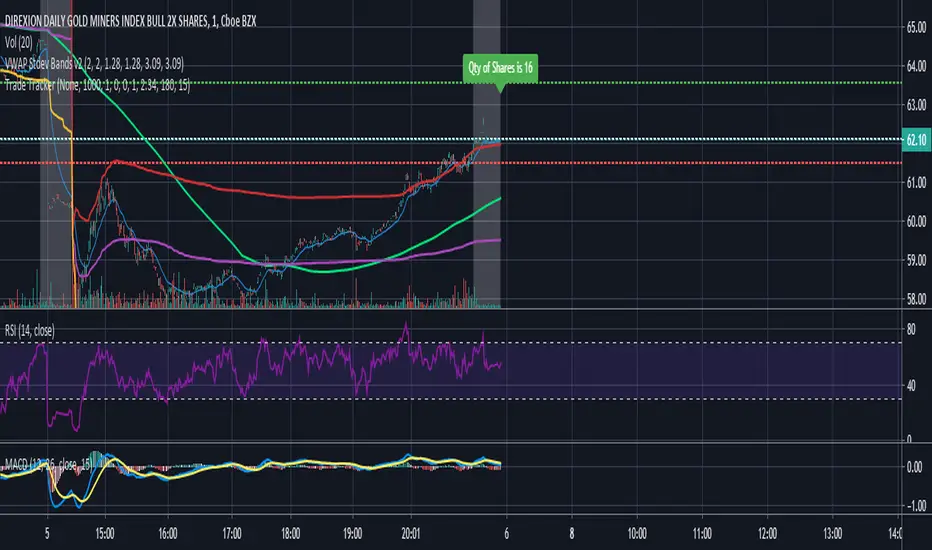
Trade Tracker - Real time stop loss and take profitTrade Tracker;
Key features
- Real time tracking of stop loss
- Real time tracking of Take Profit
- Real time tracking of break even point
- SMA integration
- EMA integration
Break even point calculated by doubling the single fee cost and adding stamp duty percentage.
Stop loss calculated by the customized percentage.
Take Profit calculated by the customized percentage.
Visually see how many shares you can buy. In the settings tab add your account balance. E.G 1000. You can then also add a portion size if you only want to trade with half your account. For this simply add 2 in the portion field. Alternatively add any multiplier you like.
ATR based Stop and Take-Profit levels in realtime Little tool to quickly identify stops and take-profit levels based on Average True Range. User can change ATR multipiers, as well as the ATR length used. Green and red lines show these levels; plot is visible over last 8 bars only to reduce clutter. Label showing the current ATR, up above the last bar

DEMARSIV1 alerts and take profitThis version is the same as DEMARSI with following differences
I add take profit to short and long when DEMA MTF 1 is crossing DEMA MTF 2 (they are calculated different that why when you increase int2 in min to longer time the difference between them increse)
if you want the TP to be on signal of fast and slow DEMA RSI 2 (just change the code inside) by putting the long cond to be as the buy cond
for any questions please ask

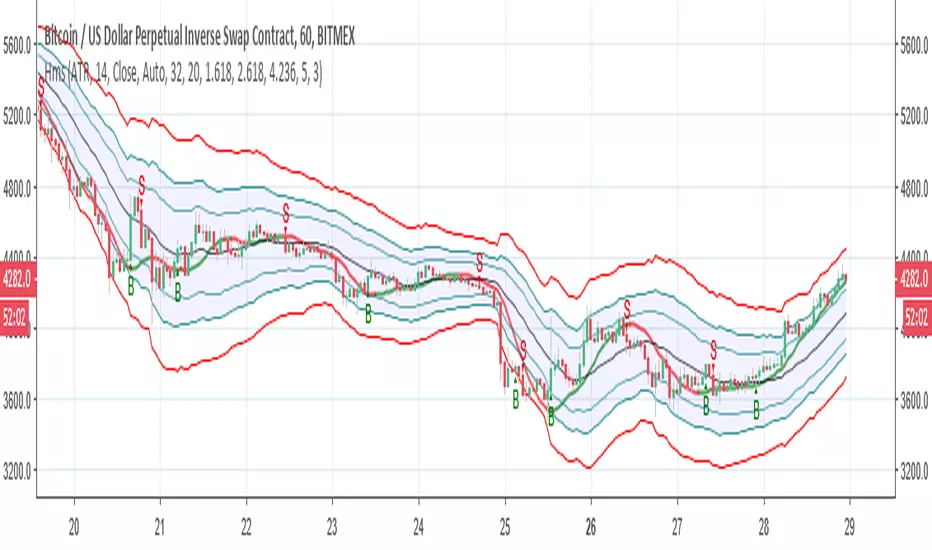
poki buy and sell Take profit and stop lossThis indicator is based on modelius model of lazy bear weis model with ATR for the buy=B sell =S
in addition there is Take profit and stop loss in % both for short and for long
next stage is to know the resistance level and support based on bollinger marked in blue and red dots
Also included Parabolic Sar (blue and red dots rising up or down)
The color of bulish or bearish zone is based on the cross of Hull avreage and linear regression ( for each time set may need different setting for accuracy )
So how to use this scrupt to better profit
1. if you have B signal and its on lower support level then its good starting place for buy. look at the Parabolic Sar if its in agreement. The exit can be either by S =sell, Take profit that you decide on % or by end of Parabolic SAR upward
2. exact the oposite for short
Play with setting for the desired results or change modify this script for your purpose

Hull modelius take profit and stop lossThis model has Hull moving average, fibs in form of Bollinger ,SMA and Modelius model with ATR for buy and sell power based on weis volume. Inside alerts for buy and sell. take profit and stop loss for both longs and shorts
so have fun
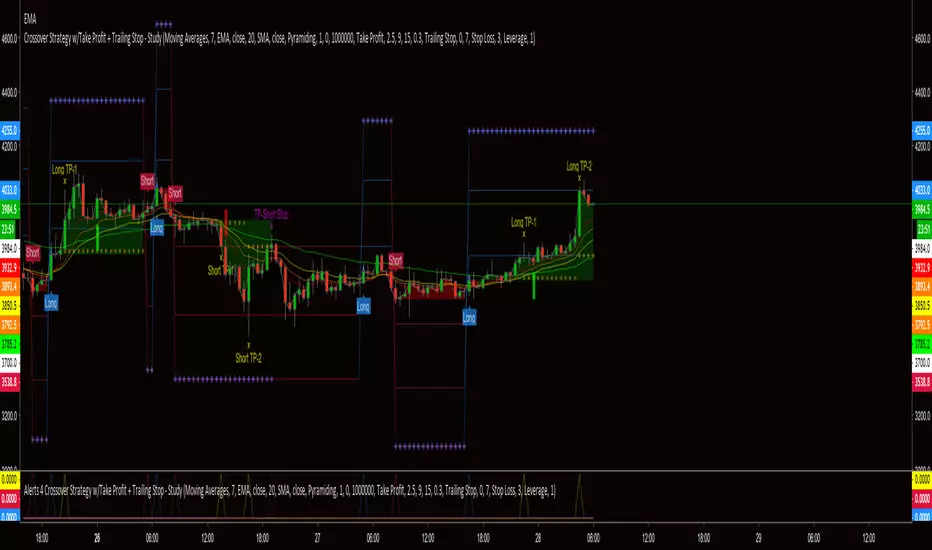
Alerts 4 Crossover Strategy w/Take Profit + Trailing StopThis is the companion script for the "Crossover Strategy w/Take Profit + Trailing Stop - Study". It's sole purpose is to provide the alert triggers for use with AutoView!!!
***** YOU MUST BE SURE THAT ALL SETTINGS MATCH THE CORRESPONDING CROSSOVER STRATEGY *****
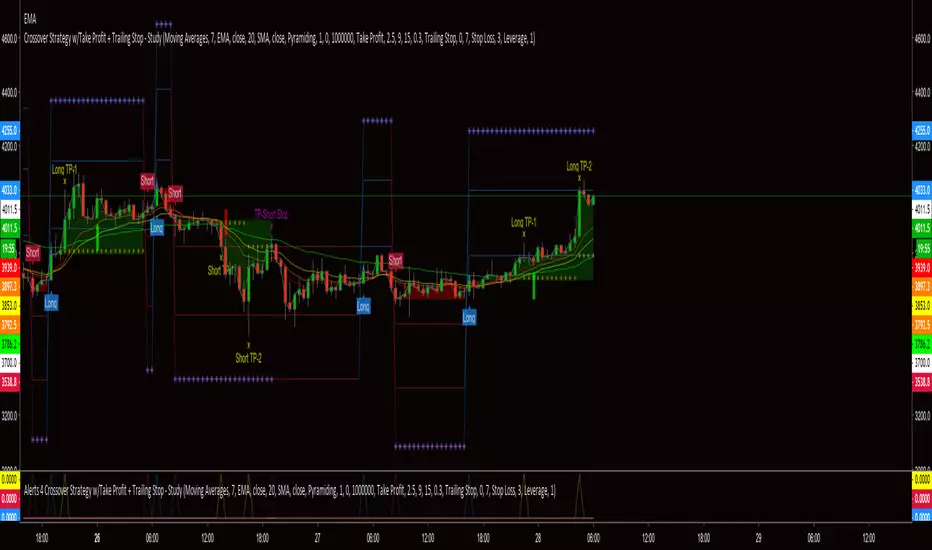
Crossover Strategy w/Take Profit + Trailing Stop - StudyThis script is a result of hours of trail, error and research. If something is not functioning as anticipated, please notify me with a description and possible screen shot of the issue.
The strategy is a basic crossover strategy. When MA1 crosses above MA2, it will trigger a long entry. When MA1 crosses below MA2, it will trigger a short entry.
When using the Take Profit function, the trailing stop will automatically activate at the defined TP3 level.
Also, when TP1 is hit a stop loss is set at 0.3% (this can be adjusted in settings) above/below the current entry. When TP2 is achieved, the stop will move up to the TP1 level.
If the trailing stop locks in LESS profit than the TP2 level, the stop will trigger at the TP2 level. This will continue until the trailing stop has moved to a level more advantageous than TP2.
There is a companion Alerts script for use with AutoView.
***AutoView syntax IS NOT provided***
EMA Cross Alerts /w Take Profit and StoplossSimple Alert for Automated Trading Based on EMA Cross.
Also includes the ability to add Take Profit, Stoploss, and Trailing.
PM for use.

Take Profit Again Trend Score(Crpto Catcher)_BinanceTPA SCORE_BINANCE ver
또땃 스코어 바이낸스 ver
------------------------------------------------------------------------------
This indicator is designed to find coins that are strong in market conditions.
It is recommended that users have an understanding of basic charts.
Careful investment is needed after the trend of the score itself has been on the downward trend.
Coins usually give the strongest return that run at the top of the score.
The realization of the profit on the chart must be done by the person himself.
When purchasing coins at the top of the score chart, we recommend the number of sheets at the adjustment point on the chart.
Because this index is a trend score, you may not be able to catch the start wave. To do this, use a starting wave catcher.
The coins listed in this index are coins of the highest rank in order of trading volume and will be updated at regular intervals.
At last year's rise of coin, it is based on catching light coin, Qtum, ripple, Ada, Stella, Tron rise.
Indicator vouchers will only be available to a small number of paid subscribers.
Thank you.
---------------------------------------------------------------------------------------------
이 지표는 시장 상황에서 강세를 띠는 코인을 찾아내기 위해 만들어 졌습니다.
기본적인 차트에 대한 이해가 있는 사용자가 사용하길 권합니다.
스코어자체의 추세가 하향을 한 이후는 신중한 투자가 필요합니다.
통상 가장 강한 수익을 주는 코인이 스코어 최상단을 달립니다.
차트상의 수익실현은 본인이 직접 수행해야 합니다.
통상 스타팅 파동을 잡아내는 스타팅 파동 캐쳐와 함께 사용합니다.
스코어차트상 최상단의 코인을 매수 할 시 차트상 조정지점에서 매수를 권합니다.
본 지표는 트렌드 점수 이기 때문에 시작 파동을 잡아내지 못할 수 있습니다.
이를 위해선 스타팅웨이브 캐쳐를 함께 사용합니다.
본 지표에 나와있는 코인들은 거래량순으로 상위등급의 코인들이며 일정 간격으로 업데이트 될 것입니다.
작년 코인상승장에서, 라이트코인,Qtum,리플,에이다,스텔라,트론 상승을 잡아낸 기반지표 입니다.
지표 이용권은 소수의 유료 구독 사용자들에게만 공개될 예정입니다.
감사합니다.

ODTE Trades Layman Signals This indicator is designed to simplify intraday options trading (0DTE / weeklies) by converting complex price-action logic into clear, easy-to-understand signals.
Instead of overwhelming traders with indicators, it performs all analysis in the background and displays only what matters:
BUY CALL / BUY PUT
Predefined Stop Loss (SL)
Two Take-Profit levels (TP1 & TP2)
Trade status and risk levels via a live status box
The goal is to help traders execute consistently without emotional decision-making.
✅ What This Indicator Does
✔ Identifies directional bias using Opening Range Breakout (ORB)
✔ Confirms structure using higher highs / lower lows
✔ Filters false breakouts using liquidity sweeps & retests
✔ Automatically plots:
Entry
Stop Loss (ATR-buffered)
TP1 (partial profit)
TP2 (runner target)
✔ Manages trades with:
Breakeven stop after TP1
Cooldown after stop loss
One trade at a time protection
✔ Displays everything clearly in a Status Box:
WAIT
BUY CALL
BUY PUT
IN TRADE
COOLDOWN
🎯 How to Use (Simple Rules)
Timeframe
Best used on 1-minute or 2-minute charts
Designed for intraday trading only
When “BUY CALL” Appears
Buy ATM or slightly ITM call option
Stop loss = Red SL line
TP1 = Take partial profits
TP2 = Let runner reach target
When “BUY PUT” Appears
Buy ATM or slightly ITM put option
Same SL / TP rules apply
When Status = WAIT or COOLDOWN
Do nothing
Avoid overtrading
⚙️ Key Features Explained
🟢 TP1 / TP2 Logic
TP1 = partial profit (risk reduction)
TP2 = trend continuation
After TP1, stop automatically moves to breakeven (optional)
🔴 Stop Loss
Based on market structure
Buffered with ATR to reduce stop-hunts
⏳ Cooldown
Prevents revenge trades after a stop loss
Helps maintain discipline
⚠️ Important Disclaimer (Required for Publishing)
This indicator does not guarantee profits.
It is not financial advice
It does not place trades automatically
All signals should be used with proper risk management
Options trading involves significant risk and may not be suitable for all traders
Always test on paper trading or small size before using real capital.
👤 Who This Is For
✔ Traders who want clear signals
✔ Options traders (0DTE / weeklies)
✔ Traders who prefer rule-based execution
✔ Users who want less clutter and more discipline
❌ Not intended for swing trading
❌ Not intended for automation or signal copying services
🧠 Philosophy Behind This Tool
The indicator follows a “less is more” approach:
Good trading is not about predicting — it’s about managing risk consistently.
This tool focuses on:
Structure
Risk control
Discipline
Execution clarity
📝 Recommended Settings (Default)
Timeframe: 2m
ATR Buffer: 0.30
TP1: 1R
TP2: 2R
Cooldown: 6 bars
Defaults are optimized for intraday use and can be adjusted per instrument.
This script will continue to be refined based on:
Market behavior
User feedback
Performance reviews
Script is overlay=true
No repainting claims
No performance guarantees
Clear disclaimer included (above)

Clean Market Structure & Trend Confirmation ( Updated ) CLEAN MARKET STRUCTURE & TREND CONFIRMATION — 24H CONTINUATION EDITION
This indicator is designed to help traders identify clear market direction, confirm trend strength, and manage trades with structured take-profit and stop levels. It works by aligning trend, momentum, and structure before showing any BUY or SELL signal. Signals are selective by design to reduce noise and false entries.
This version includes an optional continuation mode, allowing additional high-quality signals when trends persist, while still maintaining discipline and structure.
HOW TO LOAD AND USE (IMPORTANT)
Add the indicator to your chart.
Recommended symbols: SPY, QQQ, ES1!, NQ1! (works on stocks and futures).
Recommended timeframes:
• 5-minute (default and most balanced)
• 1-minute (faster, more active, optional)
No refresh is required each day. The script resets automatically.
RECOMMENDED DEFAULT SETTINGS
• 9:25 Bias Filter: ON
• Continuation Signals: ON
• TP Ladder: ON
• Keep Only Most Recent TP Ladder: ON
• Execute on Candle Close: optional (ON = safer, OFF = faster)
These defaults provide the best balance between discipline and opportunity.
HOW THE RIBBON WORKS (CORE TREND FILTER)
The ribbon is the foundation of the system.
• Teal ribbon = bullish trend
• Red ribbon = bearish trend
• Gray ribbon = no-trade zone
The system avoids signals in gray conditions to reduce chop. Only trade in the direction of the ribbon.
BULL AND BEAR DOTS
Bull and Bear dots mark confirmed trend flips.
• Bull dot = trend has flipped bullish
• Bear dot = trend has flipped bearish
These are not trades by themselves. They are early awareness signals that help you prepare for potential entries.
BUY AND SELL ARROWS (TRADE SIGNALS)
BUY and SELL arrows appear only when:
• Ribbon direction is aligned
• Trend structure confirms
• Momentum and volume agree
• Market conditions are favorable
These arrows represent high-probability trade opportunities, not constant signals.
TAKE PROFIT & STOP LEVELS
When a BUY or SELL arrow prints:
• TP1, TP2, TP3 levels appear automatically
• A STOP level is plotted automatically
• Levels are based on volatility and adjust to market conditions
Only the most recent trade plan is shown to keep the chart clean.
CONTINUATION MODE (WHAT’S DIFFERENT)
Compared to the original version:
• This version can take more than one trade per day
• It allows new trades when trends reset and realign
• It does NOT chase every candle
• It still requires full confirmation before each signal
Think of this as adaptive trend participation, not aggressive scalping.
1-MINUTE VS 5-MINUTE USE
• 5-minute: fewer signals, higher confidence, best for most users
• 1-minute: earlier entries, more activity, requires discipline
You do NOT need to switch back and forth constantly. Pick one timeframe and stay consistent.
IMPORTANT NOTES FOR NEW USERS
• Fewer signals is a feature, not a flaw
• Missing a move is better than forcing a bad trade
• Always manage risk and position size
• This indicator assists decision-making — it does not predict the future
DISCLAIMER
This indicator is for educational purposes only. It is not financial advice. Trading involves risk, and you are responsible for all trading decisions. Use proper risk management and only trade with capital you can afford to lose.

Clean Market Structure & Trend Confirmation ( UPDATED )
CLEAN MARKET STRUCTURE & TREND CONFIRMATION — 24H CONTINUATION EDITION
This indicator is designed to help traders identify clear market direction, confirm trend strength, and manage trades with structured take-profit and stop levels. It works by aligning trend, momentum, and structure before showing any BUY or SELL signal. Signals are selective by design to reduce noise and false entries.
This version includes an optional continuation mode, allowing additional high-quality signals when trends persist, while still maintaining discipline and structure.
HOW TO LOAD AND USE (IMPORTANT)
Add the indicator to your chart.
Recommended symbols: SPY, QQQ, ES1!, NQ1! (works on stocks and futures).
Recommended timeframes:
• 5-minute (default and most balanced)
• 1-minute (faster, more active, optional)
No refresh is required each day. The script resets automatically.
RECOMMENDED DEFAULT SETTINGS
• 9:25 Bias Filter: ON
• Continuation Signals: ON
• TP Ladder: ON
• Keep Only Most Recent TP Ladder: ON
• Execute on Candle Close: optional (ON = safer, OFF = faster)
These defaults provide the best balance between discipline and opportunity.
HOW THE RIBBON WORKS (CORE TREND FILTER)
The ribbon is the foundation of the system.
• Teal ribbon = bullish trend
• Red ribbon = bearish trend
• Gray ribbon = no-trade zone
The system avoids signals in gray conditions to reduce chop. Only trade in the direction of the ribbon.
BULL AND BEAR DOTS
Bull and Bear dots mark confirmed trend flips.
• Bull dot = trend has flipped bullish
• Bear dot = trend has flipped bearish
These are not trades by themselves. They are early awareness signals that help you prepare for potential entries.
BUY AND SELL ARROWS (TRADE SIGNALS)
BUY and SELL arrows appear only when:
• Ribbon direction is aligned
• Trend structure confirms
• Momentum and volume agree
• Market conditions are favorable
These arrows represent high-probability trade opportunities, not constant signals.
TAKE PROFIT & STOP LEVELS
When a BUY or SELL arrow prints:
• TP1, TP2, TP3 levels appear automatically
• A STOP level is plotted automatically
• Levels are based on volatility and adjust to market conditions
Only the most recent trade plan is shown to keep the chart clean.
CONTINUATION MODE (WHAT’S DIFFERENT)
Compared to the original version:
• This version can take more than one trade per day
• It allows new trades when trends reset and realign
• It does NOT chase every candle
• It still requires full confirmation before each signal
Think of this as adaptive trend participation, not aggressive scalping.
1-MINUTE VS 5-MINUTE USE
• 5-minute: fewer signals, higher confidence, best for most users
• 1-minute: earlier entries, more activity, requires discipline
You do NOT need to switch back and forth constantly. Pick one timeframe and stay consistent.
IMPORTANT NOTES FOR NEW USERS
• Fewer signals is a feature, not a flaw
• Missing a move is better than forcing a bad trade
• Always manage risk and position size
• This indicator assists decision-making — it does not predict the future
DISCLAIMER
This indicator is for educational purposes only. It is not financial advice. Trading involves risk, and you are responsible for all trading decisions. Use proper risk management and only trade with capital you can afford to lose.

Clean Market Structure & Trend Confirmation(Continuation 24H)CLEAN MARKET STRUCTURE & TREND CONFIRMATION — 24H CONTINUATION EDITION
This indicator is designed to help traders identify clear market direction, confirm trend strength, and manage trades with structured take-profit and stop levels. It works by aligning trend, momentum, and structure before showing any BUY or SELL signal. Signals are selective by design to reduce noise and false entries.
This version includes an optional continuation mode, allowing additional high-quality signals when trends persist, while still maintaining discipline and structure.
HOW TO LOAD AND USE (IMPORTANT)
Add the indicator to your chart.
Recommended symbols: SPY, QQQ, ES1!, NQ1! (works on stocks and futures).
Recommended timeframes:
• 5-minute (default and most balanced)
• 1-minute (faster, more active, optional)
No refresh is required each day. The script resets automatically.
RECOMMENDED DEFAULT SETTINGS
• 9:25 Bias Filter: ON
• Continuation Signals: ON
• TP Ladder: ON
• Keep Only Most Recent TP Ladder: ON
• Execute on Candle Close: optional (ON = safer, OFF = faster)
These defaults provide the best balance between discipline and opportunity.
HOW THE RIBBON WORKS (CORE TREND FILTER)
The ribbon is the foundation of the system.
• Teal ribbon = bullish trend
• Red ribbon = bearish trend
• Gray ribbon = no-trade zone
The system avoids signals in gray conditions to reduce chop. Only trade in the direction of the ribbon.
BULL AND BEAR DOTS
Bull and Bear dots mark confirmed trend flips.
• Bull dot = trend has flipped bullish
• Bear dot = trend has flipped bearish
These are not trades by themselves. They are early awareness signals that help you prepare for potential entries.
BUY AND SELL ARROWS (TRADE SIGNALS)
BUY and SELL arrows appear only when:
• Ribbon direction is aligned
• Trend structure confirms
• Momentum and volume agree
• Market conditions are favorable
These arrows represent high-probability trade opportunities, not constant signals.
TAKE PROFIT & STOP LEVELS
When a BUY or SELL arrow prints:
• TP1, TP2, TP3 levels appear automatically
• A STOP level is plotted automatically
• Levels are based on volatility and adjust to market conditions
Only the most recent trade plan is shown to keep the chart clean.
CONTINUATION MODE (WHAT’S DIFFERENT)
Compared to the original version:
• This version can take more than one trade per day
• It allows new trades when trends reset and realign
• It does NOT chase every candle
• It still requires full confirmation before each signal
Think of this as adaptive trend participation, not aggressive scalping.
1-MINUTE VS 5-MINUTE USE
• 5-minute: fewer signals, higher confidence, best for most users
• 1-minute: earlier entries, more activity, requires discipline
You do NOT need to switch back and forth constantly. Pick one timeframe and stay consistent.
IMPORTANT NOTES FOR NEW USERS
• Fewer signals is a feature, not a flaw
• Missing a move is better than forcing a bad trade
• Always manage risk and position size
• This indicator assists decision-making — it does not predict the future
DISCLAIMER
This indicator is for educational purposes only. It is not financial advice. Trading involves risk, and you are responsible for all trading decisions. Use proper risk management and only trade with capital you can afford to lose.

BLACK OPS Pro Edition (White Knight) v1.0BLACK OPS Pro Edition (White Knight) v1.0
Author: Mayo – Black Ops (WBI) Whales Belly Investments
Version: 1.0
Pine Script: v6
Overlay: Yes
Product Description
The BLACK OPS Pro Edition (White Knight) is a professional-grade TradingView overlay designed for traders seeking clarity, actionable insights, and multi-timeframe precision. This dashboard combines ultra SuperTrend flips, dynamic Delta Zones, ATR-based volatility detection, EMA trend analysis, and real-time trust indicators into a single powerful interface.
It’s built for intraday and swing traders who want instant visual cues on bullish or bearish momentum, consolidation zones, and high-confidence entry points—without cluttering the chart.
Key Features
Multi-Timeframe EMA Trend – Monitor EMA alignment across multiple timeframes for accurate trend detection.
Ultra SuperTrend Flips – Intrabar first-bar arrows highlight potential trend reversals immediately.
Delta Zones Buy/Sell Pressure – Non-persistent labels indicate strong buying or selling pressure.
ATR-Based Guidance – Stop-loss, take-profit, and volatility context for trade decisions.
Fog Overlay – Visual fog between EMAs shows short-term trend momentum; green = bullish, red = bearish.
Professional Dashboard – Upper-right table displays overall trend, signals, volatility, chop/trend status, and multi-timeframe consensus.
Trust Indicators – “✅ TRUST BUY / SELL” alerts when multiple confirmations align.
Customizable Inputs – Adjust EMAs, ATR periods, risk/reward, SuperTrend sensitivity, and visual options.
Non-Persistent Signals – Arrows and labels only display intrabar, keeping historical data uncluttered.
Installation & Instructions
Add to TradingView:
Open TradingView → Pine Editor → Paste the script → Add to Chart.
Adjust Inputs (Optional):
EMA Lengths & Filters: Fine-tune trend detection settings.
ATR / Risk Settings: Configure stop-loss and take-profit multipliers.
SuperTrend Factors: Adjust sensitivity for trend flips.
Display Options: Toggle fog overlay, labels, and arrows.
Using Signals:
Bullish Signals (🚀BUY): Confirm dashboard trend and trust indicators.
Bearish Signals (💥SELL): Check volatility, Delta Zones, and multi-timeframe consensus.
Trust Indicators: ✅ TRUST BUY / SELL appears when conditions align across trend, volatility, and multi-timeframe checks.
Dashboard Overview
Row Content Description
Overall BULL 🟢 / BEAR 🔴 / MIXED ⚪ Current market trend based on EMA + SuperTrend.
20m Trend BULL 🟢 / BEAR 🔴 / NEUTRAL ⚪ Short-term EMA trend reference.
Signals 🚀LONG / 💥SHORT Active buy/sell triggers.
Volatility HIGH ⚡ / LOW 💤 Market activity indicator using ATR.
Chop / Trend CHOP 🟡 / TRENDING 🟢 Detects consolidation vs trending conditions on lower timeframes.
Delta Zones Labels
Strong Buy: ✅ White Knight (below candle, intrabar only)
Strong Sell: ⚡ Black OPS (above candle, intrabar only)
High-confidence zones indicate significant buying or selling pressure and appear only when conditions are met to keep charts clean.
Visual Elements
Fog Overlay: Green = bullish, Red = bearish (adjustable transparency)
EMAs: Short- and medium-term EMAs plotted for trend reference
SuperTrend Arrows: Green = bullish flip, Red = bearish flip
Trust Labels: ✅ TRUST BUY / SELL signals when confirmations align
Lower-Left Watermark
Text: “Property of Black Ops Trading Company”
Semi-transparent, non-intrusive, updates dynamically with chart movement.
Lower-Right Disclaimer
⚠️ For educational purposes only. NOT financial advice.
Trading involves risk. Test strategies in paper trading first. Users are fully responsible for trades.
Marketing Blurbs
Long-Form:
“Unlock the BLACK OPS Pro Edition – your all-in-one TradingView tool for multi-timeframe trend detection, intrabar SuperTrend flips, and high-confidence Delta Zone alerts. Perfect for traders who want professional insights and actionable guidance instantly.”
“Track trend, volatility, and high-probability trade zones in real time with intuitive arrows, fog overlays, and a full dashboard. Make informed decisions faster and trade smarter.”
Short-Form / One-Liners:
“Black Ops Pro Edition: Spot trends, flips, and high-probability trades instantly!”
“Trade smarter with EMA trends, SuperTrend flips, and Delta Zone alerts!”
“See the trend, catch the flips, and know when the pros buy and sell!”
Quick Reference – Colors & Labels
Element Color
Bullish Arrows / Trust Buy Green
Bearish Arrows / Trust Sell Red
Fog Bullish Green
Fog Bearish Red
Delta Strong Buy White
Delta Strong Sell Gray
Dashboard Text Bull Green
Dashboard Text Bear Red
Dashboard Neutral / Mixed Gray / White

Strategy Validator PRO - Backtest & Alerts📊 Strategy Validator PRO is a professional analytical indicator for TradingView designed to evaluate trade configurations, risk structure, and potential outcomes under current market conditions.
The indicator generates trade signals, visualizes entry and exit levels, and provides statistical context to support data-driven trading decisions rather than assumptions.
⚠️ PRO version is available by invitation only.
A simplified FREE version is publicly available for concept evaluation.
🔶 Core Concept
Most indicators answer the question:
“Where to enter?”
Strategy Validator PRO focuses on a more important one:
“How justified is this trade under current market conditions?”
The indicator applies a predefined analytical logic and evaluates how well the current trade setup aligns with statistically stable market conditions identified on an extended historical dataset.
🔶 Key Features
📈 Trade Configuration Analysis
The indicator evaluates:
• signal quality
• current market regime (trend, consolidation, volatility)
• risk-to-outcome structure
• historical behavior of similar setups
🎯 The goal is to filter weak or unfavorable trade conditions rather than simply generate signals.
🎯 Trade Structure on Chart
Each trade is displayed directly on the chart with a clear structure:
• Entry — trade entry level
• Take Profit — projected target level
• Stop Loss — risk limitation level based on market structure and volatility
This allows immediate understanding of trade boundaries without manual calculations.
🧪 Integrated Backtest Dashboard
The indicator displays performance statistics for the active logic:
• Win Rate
• Profit Factor
• Maximum Drawdown
• Net Profit
• Total Trades
Two panels are available:
• BACKTEST — historical performance overview
• POSITION — details of the current open trade
📌 Historical data is used to provide statistical context, not to predict future performance.
🔔 TradingView Alerts (PRO)
In the PRO version, alerts can be configured using TradingView’s native alert system.
Alerts may be created for:
• trade configuration formation
• target level reached
• risk limitation triggered
Available alert formats:
• Simple — plain text
• With levels — including price levels
• JSON — structured format for external analysis
🔶 PRO vs FREE
🟢 FREE
• Base analytical logic
• Limited historical depth
• Core trade structure
• Backtest dashboard
• Trade history
🔵 PRO
• Extended historical analysis
• Higher statistical sampling depth
• Trade condition filtering
• TradingView alerts
FREE version is intended for concept evaluation.
PRO version is designed for systematic and disciplined trading.
🔶 Markets & Timeframes
🌍 Compatible with all TradingView markets:
• Crypto
• Forex
• Stocks & ETFs
• Indices
• Commodities
• Futures
⏱ Works on all timeframes — from intraday to long-term.
🔶 Access
🔓 FREE version
Publicly available.
🔐 PRO version
Available by invitation.
Access can be requested via the author’s profile links or by contacting the author directly.
⚠️ Important Notice
This indicator is an analytical tool and does not guarantee profitability.
It is not a trading robot or automated execution system.
Past performance does not guarantee future results.
Always apply proper risk management.

Strategy Validator - Backtest & Live TradeStrategy Validator is an analytical indicator for TradingView designed to evaluate trade setups, risk structure, and price behavior in real time.
The indicator builds trade scenarios, visualizes key trade levels, and provides statistical context based on historical data.
Its purpose is to help traders better understand current trade conditions and make decisions based on market structure rather than isolated signals.
🔶 Conceptual Approach
Many tools focus on a single question:
“Is there a signal right now?”
Strategy Validator approaches the market differently by analyzing a trade as a structured scenario that includes:
• current market state
• price position relative to key levels
• acceptable risk boundaries
• potential price expansion range
The indicator evaluates how well the active trade configuration aligns with historically observed market conditions and visualizes its boundaries directly on the chart.
🔶 Trade Condition Analysis
For each active configuration, the indicator evaluates:
• alignment of the entry with market structure
• market phase (directional movement, range, or elevated activity)
• risk-to-outcome relationship
• historical behavior of similar setups
The goal is to highlight trades with a clear structure and controlled risk , while filtering out weak or unstable conditions.
🎯 Trade Structure on Chart
Each trade is displayed directly on the chart with clearly defined elements:
• Entry — trade entry level
• Take Profit — projected target level
• Stop Loss — risk limitation level based on market structure and volatility
This allows immediate understanding of trade boundaries without manual calculations.
🧪 Statistical Context & Backtest
The indicator includes an integrated statistical panel showing:
• Win Rate
• Profit Factor
• Maximum Drawdown
• Net Result
• Total Trades
Two information blocks are available:
• BACKTEST — historical behavior of similar trade conditions
• POSITION — parameters and real-time state of the current trade
Historical data is used to provide analytical context, not to predict future performance.
🔶 Markets & Timeframes
🌍 Compatible with all TradingView markets:
• Crypto
• Forex
• Stocks & ETFs
• Indices
• Commodities
• Futures
⏱ Works on all timeframes — from intraday analysis to long-term charts.
🔶 Intended Use
Strategy Validator is designed for traders who:
• focus on risk-aware decision making
• prefer structured market analysis
• evaluate trades in context rather than isolation
• use statistics as a supporting decision layer
Important Notice
This indicator is an analytical tool and does not guarantee profitability.
It is not a trading robot or an automated execution system.
Past results do not guarantee future outcomes.
Always apply proper risk management.

5-Min ORB - NY Session5-Minute Opening Range Breakout (ORB) - NY Session Indicator
This TradingView indicator identifies and plots the Opening Range Breakout (ORB) based on the first 5-minute candle of the New York trading session.
Key Features:
Automatic Detection: Automatically detects the NY session open (default 9:30 AM ET, fully customizable) and captures the high/low of the first 5-minute bar
Multi-Timeframe Support: Works on any chart timeframe (1-min, 3-min, 15-min, etc.) by requesting 5-minute data
Dynamic Price Targets: Calculates both bullish (above ORB high) and bearish (below ORB low) price targets based on the opening range size
Configurable Targets: Set up to 10 price target levels on each side, with targets spaced proportionally to the ORB range
Extended Lines: All lines automatically extend ahead of the current bar by a configurable number of minutes for better forward visibility
Price Labels: Optional price labels display exact values at the end of each level
Midpoint Line: Optional dashed midpoint line shows the center of the opening range
Custom Styling: Fully customizable colors and transparency for all lines and labels
How It Works:
The indicator measures the distance between the ORB high and midpoint, then projects additional targets at equal intervals above the high (bullish targets in green) and below the low (bearish targets in red).
Why Use a 5-Minute ORB?
Tighter Range: The 5-minute opening range is typically smaller than the 15-minute range, providing more precise entry and exit levels
Earlier Signals: Breakouts are identified sooner, allowing for faster reaction times
Scalping-Friendly: Ideal for day traders and scalpers who prefer shorter timeframes and quicker price movements
Higher Probability Zones: The narrower range often creates more reliable support/resistance levels for intraday trading
Best Practices:
Works best on liquid instruments with high volume during NY session open
Combine with volume analysis to confirm breakout validity
Consider using the first target as a take-profit level for quick scalps
Watch for false breakouts within the first 15-30 minutes of the session
